Topics: Economics / Politics
01.02.2004
Russia must analyse the challenges facing developed nations not for a blind
replication of Western solutions but for carefully adjusting Western
experiences to Russian specifics and ensuring that a possible problem is
addressed before it entrenches and a needed reform is overdue.
In discussing Russia's long-term prospects, it is important to analyse how the
country has been developing over
the last two centuries, rather than over three or ten years. If we consider the
evolution of Russia's economy against the background of global development over
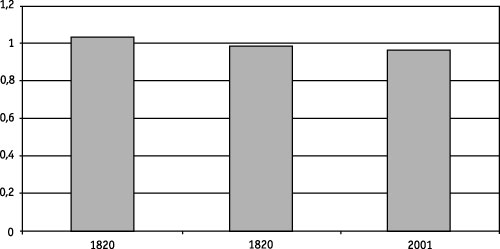
the last two centuries, we discover that in 1820 Russia's GDP per head was
close to the average worldwide indicators and it remained roughly on the same
average worldwide level (taking into account the accuracy of the calculations)
both in 1913 and 2001 (see Fig.1).
Fig.1. Correlation between Russia's GDP per head and the world GDP per head from 1820 to 2001
Source:
1. For 1820 and 1913: A. Maddison. The World Economy. A Millennial Perspective.
2. For 2001 – the IET computations based on the data of A. Maddison.
3. Reconstruction of World Bank data pre 1950 provides similar results within the limits of accuracy of calculations.
1. For 1820 and 1913: A. Maddison. The World Economy. A Millennial Perspective.
2. For 2001 – the IET computations based on the data of A. Maddison.
3. Reconstruction of World Bank data pre 1950 provides similar results within the limits of accuracy of calculations.
It is fairly easy to explain the reasons for the selection of these particular
dates. Most researchers believe that modern economic growth
– a process of drastic acceleration in the pace of economic development
accompanied by large-scale shifts in the structure of the economy and social
relations
– started in the 1820s[1]; 1913 – is the peak of the Russian Empire's development, while 2001 is the most recent
date for which data is currently available.
Naturally, Russia's GDP was deviating from the World, average between these
three points, but such fluctuations were fairly moderate. The gap between
Russia and the leading nations in world development (the UK in the 19th Century
and the US in the 20th Century) has been fluctuating over these two centuries
too, but again these happened within rather a narrow range (see Table 1).
Table 1. Correlation between Russia's GDP per head and GDP per head of the
leading nations in modern economic growth*
| Year | 1820 | 1870 | 1913 | 1950 | 2001 |
| Ratio | 0.44 | 0.32 | 0.28 | 0.30 | 0.25 |
* 1820-1870 – UK, 1913-2001 – US
Over the last quarter of the 20th Century, it has been China's successful record
of economic performance that has drawn everyone's attention. Ironically the
fact that a drastic fall in China's share in the world economy has constituted
one of the most profound structural shifts in the latter between 1820 and the
1970s is often ignored. Nowadays, after some 25 years of rapid growth, the
country's share in the world GDP is a third of its equivalent in 1820, while
its
GDP per head currently accounts for roughly half of the average global level
(while in 1820 it was on a par with it).
Against such a background, the closeness of Russia's economic indicators to
their respective global averages is worth the attention, and it becomes even
more important considering that world economic development has undergone
unprecedented changes over the last two centuries.
It was an outstanding US economist S. Kuznets who introduced the concept of
modern economic growth in economics. He believed the phenomenon emerged in the
late 18th Century[2]. Today, this view is being challenged by some of the most
authoritative experts who are more inclined to date it back to the 1820s
– the aftermath of the Napoleonic wars.
The exact date is of no fundamental significance – what matters is the sharp acceleration of growth rates of the world economy and
GDP per head between the late 18th and the early 19th Centuries that was taking
place against the background of radical structural transformations in
employment, geographical expansion, and demography.
Prior to the modern economic growth era it took Western Europe, the region that
had been developing abnormally fast over the previous millennium, eight
centuries (roughly between 1000 to 1800) to double its GDP per head during the
period. The leader of modern economic growth in the 20th Century the US, has
seen its productivity rising on average by 2 %, that is 2% for over the last
two centuries. It means that during a single generation's lifetime (75 years)
per head GDP has grown more than 4-fold.
A number of common sweeping mutually related transformations have been taking
place in countries with seemingly different cultural traditions, resource
bases, and geographical locations. It would only be logical to assume that an
understanding of these general processes which follow similar scenarios related
to economic development would provide a strong tool to a researcher dealing
with long-term economic growth.
It is no coincidence that faith in the ability of such absolute laws of
historical development to predict and logically explain the world formed the
core of Marxism, a theory which between the late 19th
– early 20th Century dominated the study of the long-term prospects for the
evolution of socio-economic relations. Yet the 20th Century has also exposed an
important feature of modern economic growth that neither Marx, nor Marxists had
been able to product in their time: modern economic growth is accompanied by
rapid and unpredictable changes in the dominating trends in socio-economic
systems and nation
’s economies. The history of socio-economic theory over the last two centuries is
rife with dramatic errors of great thinkers who attempted to extrapolate the
trends they had witnessed in their time onto the future. Notably among them
were T. Malthus, with his prophecy of overpopulation and global starvation
which he based on the actual facts he had witnessed in his lifetime, such as a
rise in life expectancy and lower infant mortality
– all of which we now know were attributes of an early stage of demographic
transition; Karl Marx, with his prognosis of an absolute and relative
impoverishment of the proletariat, social destabilization and the collapse of
capitalism, which he in his turn based on actual social problems of the early
stages of modern economic growth; J. Shumpeter, who in his book entitled
Сapitalism, Socialism and Democracy forecasted the fading of entrepreneurship
and the bureaucratisation of economic life, no doubt a product of the grim
reality of assembly line manufacturing dominant in his time.
In financial and fiscal theory, the concept of the impossibility of exceeding
the then existing upper marginal taxation rates has been a convention until the
late 19th Century. In the 1870s A. Wagner questioned that paradigm and was the
first to formulate a hypothesis stating that the share of resources subject to
the government's re-allocation would rise in parallel with the size of the
economy. The hypothesis found its empirical proof in the 20th Century, when a
drastic expansion of the modern states' capacity against a background of rising
living standards, allowed considerable increases in state withdrawals from the
GDP. From 1910 and 1970, the idea of unlimited horizons for increasing state
tax revenues became an accepted view in financial literature, while
researchers, who tried to argue that even in industrial economies there is a
limit to state taxation compatible with economic growth, were ridiculed.
In the 1970s this conventional view came under scrutiny as the evidence grew
that in developed nations, where taxation rates hit levels close to 50% of the
GDP, they were plagued by serious problems such as politically organized
taxpayers' resistance and expansion of the shadow economy, a slowdown of
economic growth and a loss of competitiveness on the international markets.
From the current perspective, it is evident that the process of tax withdrawals
rising from the levels characteristic of agrarian societies (some 10% of the
GDP) to the one available for highly developed post-industrial economies
(30-50% of the GDP) was transitional. It was practically impossible to forecast
its development until it was over.
Whilst advocating the gold standard in the UK at the end of World War 1 and
pursuing a deflationary policy for the sake of re-establishing the British
Pound's parity with gold, Winston Churchill was guided by a two-century-long
national tradition that had ensured the United Kingdom's role as the world
economic leader. Churchill essentially repeated what had been done in the
aftermath of the Napoleonic wars, yet, given the radically changed conditions,
such a policy was encouraging the world towards one of the most intense
economic crises of the past century
– the Great Depression. The gold standard that had played a crucial part in
launching modern economic growth later proved to be incompatible with the
consequent stages of growth.
The fact that modern economic growth appears an incomplete, ongoing process, of
which rapid and radical changes in dominating trends are characteristic,
substantially complicates the use of exposed regularities to forecast the
development of the leading countries that form a vanguard of mankind's economic
development. But the leading nations, i.e. those that began their economic
growth in the first decades of the 19th Century hold a different position than
those who underwent modern economic growth and the respective socio-economic
transformations somewhat later[3]. The experiences of the pioneering group
allow important conclusions to be drawn on challenges and trends that will face
the latter group, i.e. the so-called catch-up development nations, in the
future.
Leading nations and catch-up economies
There are authors that assume the inevitability of a further development in the
globalization process, and those who believe that the world is on the threshold
of de-globalization. It is impossible to prove either assumption, but one can
argue, with a high level of probability, that over the next 50 years, Russia
will have to cope with the problems that leading nations in modern economic
growth were tackling during the second half of the 20th Century, at the stage
now called post-industrial.
One of the greatest economists in the world history, Adam Smith avoided numerous
mistakes characteristic of his followers precisely because he analyzed problems
related to catch-up development[4]. He was not concerned about the problems and
prospects of Holland
– then a European economic leader, for he believed that the country had reached
the level of its maximum possible productivity and would from then on slide
into stagnation[5].
Karl Marx has extended the concept that the current state of the more developed
nations was a preview of a future for their less developed peers into a stern
determinism. He argued that,
”It is not the high or low level of development of those social antagonisms which
proceed from the natural laws of capitalist production. It is the laws and
tendencies themselves that function and realize themselves with a strict
necessity. A more industrially developed country shows a less developed one but
a picture of its own future
”[6]. However, Marx underestimated three important factors that separated the
paths taken by catch-up development nations from
leading nations, development trajectories of which have already manifested
themselves in the 20th Century.
The first of them is the sustaining gap between leading nations and catch-up
development nations. The dissemination of knowledge and technologies born by
modern economic growth appears unevenly dispersed: for instance, a mass
application of modern anti-epidemiological means in catch-up development
nations occurs at a far greater pace than the spread of modern business
technologies. The fall in the mortality rate and the rise in the life
expectancy now takes place during earlier stages of economic development. Since
in today's poor countries the lower mortality is also combined with a high
birth rate, their share in the world populations is rising
The second factor is the importance of the conditions of the global economic
environment set by its leaders. The latter undergo different stages in their
structural transformations that impact the whole world economy. More
specifically, between the 1870s through to the 1910s the world economy had been
functioning in the conditions of a global commodity and capital market based on
the gold standard. That influenced the economic strategy options of the nations
that entered the process of modern economic development during those decades.
Between 1914 and 1950 the global development found itself severly affected by
wars, the crisis of the gold standard, and a protectionist policy that pre-set
the limits for maneuver values for the catch-up development nations, thus
forcing them towards opting for a protectionist policy and import-substitution
industrialisation. In the late 20th Century, the world once again entered the
era of globalization marked by lowered customs tariff rates and the opening
capital markets
– all taking place under floating rates of major world currencies: rather than
the gold standard. That created new opportunities favoring strategies aligned
towards boosting exports and integration into the world economy.
Regretfully, however hard we try, in the coming decades the world development
context will be set by developments advanced by the US, Western Europe and
Japan, rather than Russia, India, or Brazil. The economic and political
processes that manifest themselves in the leading nations will have a strong
effect on the national development strategies of nations following in their
footsteps.
The third factor that determines the specificity of the catch-up development
path is various national traditions inherited from the respective agrarian
civilizations. For instance, the family relations which emerged in Western
Europe over the last millennium appear different from those in Muslim
countries, as well as those dominated by Buddhism or Confucianism. The spread
of a small or big family and family solidarity customs exercise a substantial
impact on the development of social protection systems, national savings
standards, and economic development as a whole.
The significance of the leading countries' experiences for catch-up development
nations lies with the appreciation of the strategic challenges that they will
face, a way of minimising risks and avoiding a predecessor's mistakes, rather
than blindly copying them.
Had Marxism been as popular in today's Russia as it was in the early 20th
Century, the context and key terms of the debate on the national long-term
development problems would be as follows the trends of transformations of
socio-economic establishments in the leading countries in of economic growth;
the ability of Russian national institutions to adapt accordingly; the measures
that would allow the adjustment of Russian establishments to relevant
challenges in economic development[7].
The collapse of the socialist experiment has seriously undermined the popularity
of Marxism in the country. But as the saying goes,
”do not throw the baby out with the bathwater.” In other words, the experiences of the most advanced nations' socio-economic
development over the last half-century has some valuable lessons for
understanding the challenges Russia will face in the first half of the 21st
Century.
If one compares Russia's current GDP per head with that of the leading nations
in economic growth one will be able to fully appreciate the gap that exists
between them (see Table 2).
Table 2. The years when GDP per head of the leading nations in modern economic
growth was equal to Russia's
| Country | Year |
| USA | 1935 |
| Australia | 1936 |
| Canada | 1941 |
| New Zealand | 1948 |
| UK | 1934 |
| Sweden | 1944 |
| Germany | 1953 |
| France | 1951 |
| Italy | 1959 |
Source:-
1. Russia's GDP per head – data from the World Development Report, World Bank, 2003, in USD equivalent- Geary-Khamis, 1990.
2. The data on GDP per head in other countries, see: A.Maddison. Monitoring the World Economy 1820-1992, OECD 1995.
1. Russia's GDP per head – data from the World Development Report, World Bank, 2003, in USD equivalent- Geary-Khamis, 1990.
2. The data on GDP per head in other countries, see: A.Maddison. Monitoring the World Economy 1820-1992, OECD 1995.
The accuracy of the calculations of GDP per head in purchasing power parity
(PPP) terms appears rather limited, so one should exercise caution while
drawing conclusions from such comparisons. But the data presented in Table 2 on
the whole show that the gap between Russia and leading nations today amounts to
about 40 to 60 years.
Let us compare the evolution of Russia's GDP over a long period with those of
the large countries of continental Europe (France and Germany). While
considering the distance between Russia and the leading countries, it is
worthwhile to take these particular countries as a starting point: like Russia,
they were involved in two World Wars on their territories in the 20th Century
which had a similar distorting effect on their development
Table 3. Russia's backwardness in contrast to Germany and France in terms of
GDP* per head (in years)
| Countries | Years |
|||
1870 |
1913 |
1950 |
2001 |
|
| France | 60 |
63 |
46 |
50 |
| Germany | 60 |
63 |
55 |
48 |
*Russia's GDP per head until 1913 implies the Russian Empire within the USR
borders, in 1950
– the USSR, in 2001 – the Russian Federation
Source:
1. The data on GDP per head 1870-1950, see: A. Maddison. Monitoring the World Economy 1820-1992. Development Center Studies, OECD, 1995.
2. The data on GDP per head in 2001 – see: the World Development Report 2003. The World Bank. The data in USD equivalent – Geary-Khamis 1990.
Source:
1. The data on GDP per head 1870-1950, see: A. Maddison. Monitoring the World Economy 1820-1992. Development Center Studies, OECD, 1995.
2. The data on GDP per head in 2001 – see: the World Development Report 2003. The World Bank. The data in USD equivalent – Geary-Khamis 1990.
The data presented in Table 3 shows that Russia's backwardness compared to
Germany and France in terms of GDP per head has been fairly stable over one and
a half centuries[8].
This is not random, out-of-context data on the GDP per head of Russia, France,
and Germany
– the noted changes generated other significant structural transformations in
these particular economies.
Table 4. The proportion of urban population in the overall population of
Germany, France and Russia, at 50 year intervals (%).
| Countries | Years |
|||
| 1850 – Russia 1800 – Germany, France |
1910 – Russia 1850 – Germany, France |
1950 – Russia 1910 – Germany, France |
2000 – Russia 1950 – Germany, France |
|
| Russia | 7 | 14 | 44,7 | 77,7 |
| Germany | 9 | 15 | 49 | 71,9 |
| France | 12 | 19 | 38 | 56,2 |
Source:
1. 1800-1900: P.Bairoch, Cities and Economic Development: from the Dawn of History to the Present, Chicago, 1988
2. 1950-2000: The UN database (http://esa.un.org/unpp)
Table 4 contains data concerning the dynamics of the share of Russia's urban population in Russia, Germany and France over the last two centuries at 50 year intervals and shows a similar picture, i.e. Russia's backwardness roughly amounts to two generations (150 years).
Table 5. The share of employed in the agrarian sector out of the total
economically active population of Germany, France and Russia, at 50 year
intervals (%)
| Countries | Years |
||
| 1900 – Russia 1850 – Germany, France |
1950 – Russia 1900 – Germany, France |
2001 – Russia 1950 – Germany, France |
|
| Russia | 59.11 (1897)(*) | 45.83 (1959) | 10.02(3) |
| Germany | - | 36.84 (1907) | 23.63(2) |
| France | 51.72 (1856) | 41.43 (1901) | 24.06(2) |
* Here and throughout the Table after some of the figures there is a date in
pocken thesis. The date is the closest to the one required, given the avialable
date.
Source:
1. (If not stated otherwise) B.R.Mitchell, International Historical Statistics 1750-1993, Macmillan Reference LTD, 1998
2. Groningen Growth&Development Center Sectoral database (http://www.eco.rug.nl/ggdc)
3 Rossiisky statistichesky ezhegodnik, Goskomstat Rossii, 2002.
Source:
1. (If not stated otherwise) B.R.Mitchell, International Historical Statistics 1750-1993, Macmillan Reference LTD, 1998
2. Groningen Growth&Development Center Sectoral database (http://www.eco.rug.nl/ggdc)
3 Rossiisky statistichesky ezhegodnik, Goskomstat Rossii, 2002.
Table 6. The share of employed in the industrial sector out of the total
economically active population of Germany, France and Russia, at 50 year
intervals (%)
| Countries | Years |
||
| 1900 – Russia 1850 – Germany, France |
1950 – Russia 1900 – Germany, France |
2001 – Russia 1950 – Germany, France |
|
| Russia | 13.87 (1897)(*) | 40.27 (1959) | 24.97(3) |
| Germany | - | 33.84 (1907) | 35.21(2) |
| France | 23.30 (1856) | 26.53 (1901) | 26.82(2) |
* Here and throughout the Table after some of the figures there is a date in
pocken thesis. The date is the closest to the one required, given the avialable
date.
Source:
1. (If not stated otherwise): B.R.Mitchell, International Historical Statistics 1750-1993, Macmillan Reference LTD, 1998
2. Rossiisky statistichesky ezhegodnik, Goskomstat Rossii, 2002.
3. Groningen Growth&Development Center Sectoral database (http://www.eco.rug.nl/ggdc)
Source:
1. (If not stated otherwise): B.R.Mitchell, International Historical Statistics 1750-1993, Macmillan Reference LTD, 1998
2. Rossiisky statistichesky ezhegodnik, Goskomstat Rossii, 2002.
3. Groningen Growth&Development Center Sectoral database (http://www.eco.rug.nl/ggdc)
Tables 5 and 6 illustrate similar structural changes in employment; notably, a
faster contraction in employment in Russia's agrarian sector is most likely to
be associated with specific features of the socialist industrialization model.
In the USSR, a large-scale reallocation of resources from the agrarian sector
to finance investment in the industrial sector created strong incentives for an
exodus of peasants from the countryside.
We consider the countries' development paths over the period of one and half
centuries that cover the stage of drastic socio-economic transformations. In
Russia, this particular period comprised of two revolutions, the collapse of
two empires, two World Wars and one Civil War, the greatest socio-economic
experiment in world history called socialism, and its break-up. Nevertheless,
during the period in question the gap between Russia's level of development and
that of the largest nations of continental Europe remained fairly stable and
roughly amounted to two generations (50 years). Having started modern economic
growth as early as two generations after Western Europe, i.e. in the 1880s,
Russia has maintained that gap. This, by no means should point us to a
conclusion that such a time lag is somehow pre-destined to remain forever.
Nonetheless, a careful analysis of the development of the socio-economic
processes in the leading nations of economic growth in the last five decades
clearly proves to be a useful tool estimating Russia's long-term prospects.
W. Easterley demonstrated the vulnerability of existing models that attempt to
explain the differences in national economies' growth rates[9]. He showed that
for each factor, believed to be the single most important determinant of
growth, (be that the share of investment in GDP, educational expenditure,
etc.), there will always be a number of countries which satisfy that criteria
yet do not exhibit growth. With that hypothesis Easterley also introduced an
imprecise, but an interesting term
– ”national institutions' capacity to secure economic growth”. Should we apply this concept to the realities of Russia's development over the
last one and a half centuries, it can be argued that Russia's socio-economic
institutions' capacity to secure economic growth has been at the average
worldwide level over the entire period in question.
If we agree with the hypothesis that the gap which remained for over one and a
half centuries will continue, then in 50 years time Russia's living standards,
lifestyle, employment structure, and infrastructure will be roughly the same as
those currently noted in Germany or France. That suggests an annual growth rate
in GDP per head of some 2%, i.e. the pace of growth in the world economy over
the past five decades. Should the Russian economy be developing at the present
pace, i.e. by some 4% annually, over the forthcoming decades, this gap could be
partly bridged in 25 years, thus allowing a reduction in its backwardness from
the leaders down to one generation.
The awareness of the scale of the gap that has long separated Russia from the
leading nations is necessary not for the sake of manipulation with the figures
of growth and the creation of forecasts on their basis. Rather, it is
necessary, first, to form a clear vision of where the difference between
Russia's past development from that of leading nations lay and apparently
remain; and second, what structural challenges will the country face in future
stages of its economic development.
Russia's demographic dynamics: the specific legacy of socialism
As far as a set of key socio-economic characteristics is concerned, the area
where Russia's development appears different from that of leading nations is
its demographic dynamics (see Table 7)
Table 7. The share of nations in the world population (%)
| Countries | Years |
|||
| 1900(2) | 1950 | 2000 | 2050 | |
| Russia | 4.31(4) | 4.03 | 2.34 | 1.04 |
| US | 4.63 | 6.26 | 4.55 | 3.96 |
| Japan | 2.67 | 3.32 | 2.04 | 1.09 |
| UK | 2.33 | 2.01 | 0.95 | 0.59 |
| France | 2.46 | 1.66 | 0.95 | 0.62 |
| China | 24.24 | 22.01 | 20.47 | 14.59 |
Source:
1. (If not stated otherwise) Population Division of the Department of Economic and Social Affairs of the UN Secretariat, World Population Prospects: The 2000 Revision and World Urbanization Prospects: The 2001 Revision. http://esa.un.org/unpp (moderate projections for 2050).
2. A.Maddison. Development Center Studies. Monitoring the World Economy 1820-1992. OECD, Paris, 1995.
3. The ratio of Russia's population in 1897 (according to Source 4) to the world population in 1900 (according to source 2) ratio
4. Naselenie Rossii za 100 let (1897-1997), Goskomstat Rossii, M., 1998.
The decline in Russia's share of population in the overall global population
does not constitute a unique phenomenon. The non-immigrant leading nations have
also experienced a steady decline in their respective shares over the last
century. The difference in this respect lies with the fact that Russia, which
started its modern economic growth two generations later compared to the
leaders and had its share in the world population rapidly increasing in the
early 20th Century, was supposed to, providing an inertial development of the
situation, have by the late 20th Century a far greater proportional number than
it actually has now.
What happened in Russia was related both to large-scale social catastrophes (two
world wars, the civil war, collectivization, repressions) and the specifics of
the socialist industrialization model the country pursued for the most part of
the last century.
Table 8. The share of women in the total number of the economically active
population (%)
| Country | Years |
||
| 1900(1) | 1950(2) | 2000(2) | |
| Germany | 30.7(1907)* | 38.9 | 42.3 |
| Russia | 16.4(1897) | 51.5 | 49.2 |
| France | 35.3(1901) | 31.8 | 45.1 |
* Here and throughout the table the year on which the respective index (the
closest to the required year out of the data available) is given in
parenthesis.
Source:
1. Calculated basing on: B.R.Mitchell, International Historical Statistics 1750-1993, Macmillan Reference LTD, 1998.
2. Calculated based on the data of the United Nations Common Database, Economically active population by sex, 13 age groups (ILO estimates/projections).
Source:
1. Calculated basing on: B.R.Mitchell, International Historical Statistics 1750-1993, Macmillan Reference LTD, 1998.
2. Calculated based on the data of the United Nations Common Database, Economically active population by sex, 13 age groups (ILO estimates/projections).
The data presented in Table 8 shows that the socialist model of
industrialisation suggested an unusually early involvement of women in
employment outside the household. As early as 1950 the women's share in the
overall number of employees in Russia had already been greater than it would
have been in France and Germany by 2000, i.e. at the stage of a developed
post-industrial society. The process of getting women involved in employment
entails a parallel process of contraction in the number of births per woman.
The data of Table 9 shows the development of this particular process in Russia,
Germany, France, and Spain[10]. From the perspective of demographic processes
associated with modern economic growth, Russia had begun to witness the fall in
the average lifetime fertility per woman roughly in two generations earlier
than the leading nations.
Table 9. The average lifetime fertility per woman
| Country | Years |
||
| 1950-55 | 1975-80 | 1995-2000 | |
| Germany | 2,16 | 1,52 | 1,34 |
| Spain | 2,57 | 2,57 | 1,19 |
| Russia | 2,85 | 1,94 | 1,25 |
| France | 2,73 | 1,86 | 1,76 |
Source: the UN database (http://esa.un.org/unpp)
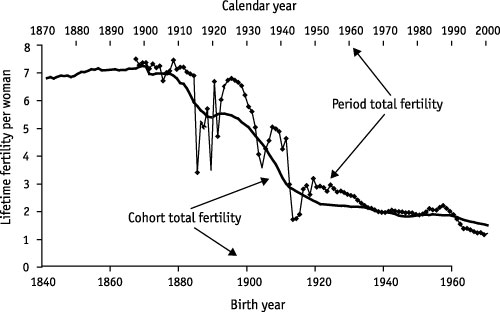
The statistics of births is distorted by the impact of demographic waves caused
by the two World Wars. The data arranged by S. Zakharov concerning the lifetime
fertility rate per woman in Russia across the total age cohorts and presented
below in Fig.2 is built on their basis and show a correlation between the path
of demographic transition and the socialist model of industrialisation.
Fig. 2
Source:
Zakharov S.V. ”Rozhdayemost v Rossii: pervy i vtoroy demographichesky perekhod”/”Demographicheskaya modernizatsia, chastnaya zhizn i identichnost v Rossii”, abstracts of presentations of a scientific conference, Moscow 27-28 February 2002. M., TSDECH RAN, 2002, pp. 19-26. These materials are available courtesy of S.V. Zakharov.
Zakharov S.V. ”Rozhdayemost v Rossii: pervy i vtoroy demographichesky perekhod”/”Demographicheskaya modernizatsia, chastnaya zhizn i identichnost v Rossii”, abstracts of presentations of a scientific conference, Moscow 27-28 February 2002. M., TSDECH RAN, 2002, pp. 19-26. These materials are available courtesy of S.V. Zakharov.
Yet another factor that determined the decline in Russia's proportion in the
overall global population is also associated with the socialist
industrialisation model. As the data presented in Table 10 shows, one can see a
gradual convergence between Russia's life expectancy indices and those of
leading nations in economic growth until the mid-1960s, while the process has
discontinued hence[11]. The sustainability of Russia's life expectancy figures
against a background of the growing gap between the nation and the leading
nations over nearly
40 years has constituted a very unusual fact in the world demographic history.
Table 10. The average life expectancy rates at birth (as years)
| Country | Years |
|||||
| 1950 | 1960 | 1970 | 1980 | 1990 | 2000 | |
| Russia | 64.5 | 67.9 | 69.7 | 68.3 | 66.9 | 66.1 |
| USA | 68.9 | 70.0 | 71.5 | 74.0 | 74.9 | 76.2 |
| Japan | 63.9 | 69.0 | 73.3 | 76.9 | 79.5 | 80.5 |
| UK | 69.2 | 70.8 | 72.0 | 74.0 | 76.4 | 77.2 |
| France | 66.5 | 71.0 | 72.4 | 74.7 | 77.5 | 78.1 |
| Germany | 67.5 | 70.3 | 71.0 | 73.8 | 76.2 | 77.4 |
Source: Population Division of the Department of Economic and Social Affairs of
the United Nations Secretariat, World Population Prospects: The 2000 Revision
and World Urbanization Prospects: the 2001 Revision (http://esa.un.org/unpp).
Most likely, there were two factors that played their role in this respect:
demographists have long established a link between women's nutrition during
pregnancy and children's nutrition during their first years with the average
height of a new generation and the life expectancy rate. As concerns the age
cohorts born between the 1920s and early 1950s, these indicators appear
substantially worse than those of the preceding and subsequent generations. The
risk that a man born in the mid-1920
’s, when the overwhelming majority of births fell on free peasants' families,
would die at the age of 30-40 was roughly half of that of a child born between
the late 1940s and early 1950s. It was only in the mid-1950s that these indices
showed some improvement[12]. The connection between such destinies with
collectivization and World War II is obvious.
Table 11. Consumption of alcohol per head (for residents aged over 15 years old)
in ethyl alcohol equivalent between 1960 and 2000 (liters)
| Years | Country |
||
| Russia | France | Germany | |
| 1960 | 4.88(2) | 32.62* | 10.71* |
| 1970 | 10.38(2) | 33.87 | 15.11 |
| 1980 | 13.40 | 33.34 | 16.18 |
| 1990 | 7.09 | 22.60 | 14.67 |
| 1999 | 10.80 | 19.87 | 12.99 |
* 1961
Source:
1. If not stated otherwise: http://www3.who.int/whosis. WHO Statistics, Global Alcohol Database.
2. Estimated (based on the data of Goskomstat,
review ”Naselenie i obschestvo”, № 19-20 (May 2001) http://www.demoscope.ru.)
Source:
1. If not stated otherwise: http://www3.who.int/whosis. WHO Statistics, Global Alcohol Database.
2. Estimated (based on the data of Goskomstat,
review ”Naselenie i obschestvo”, № 19-20 (May 2001) http://www.demoscope.ru.)
Another factor is a country-specific environment of the mass alcoholisation
among Russia's population in the 20th Century. As the data presented in Table
11 shows, Russia total alcohol consumption per head, while substantially behind
France, is close to that of Germany. The distinctiveness of Russia's situation
however is not in the volume of consumption per head but in its style, which is
characterised by the prevalence of strong drinks, intemperance, and a
widespread habit of drinking in the workplace. At the same time, this is not
only a Russians' trend
– papers on the history of alcoholism and alcoholic behavior in Germany in the
late 19th Century expose similar challenges facing that country with those
facing Russia in the 20th Century[13].
In Northern European countries, the consumption of alcohol was considered to be
compatible with economic activity in the agricultural sector
– it was, after all, one way of retaining body warmth not to mention its purpose
as a social lubricant and a source of additional calories. In the mid-19th
Century, having left his village for a city and found a job at a factory, a
German peasant would keep on preserving the tradition he had adopted in his
village. The custom of a mandatory bottle of vodka as a pass for an apprentice
to his new collective; rejection of a member of the collective who does not
contribute to collective feasts
– these customs mirror well known realities of German life in the late 19th
Century. The workers' struggle for the right to drink at work formed one of the
German working-class movement's major demands.
It was only by the late 19th Century that Germany had reached a level of
development similar to the one seen in the USSR in the 1930-50
’s, when the situation began to change, and both employers and trade-unions'
embraced ideas of abstinence at work, replacing it with a happy-hour at the
local beerstube outside the factory's walls instead.
This transition was never noted in the USSR. Against the background of
uravnilovka (equal labor compensations that everyone was entitled to), a weak
sense of communal responsibility, the absence of an initiative
in setting some socially acceptable norms of alcoholic behavior characteristic
in the early industrial stage, the mass alcoholism problem was aggravating
further. Moreover, it significantly contributed to the discontinuation of the
rise both of the average life expectancy and the growing gap between men and
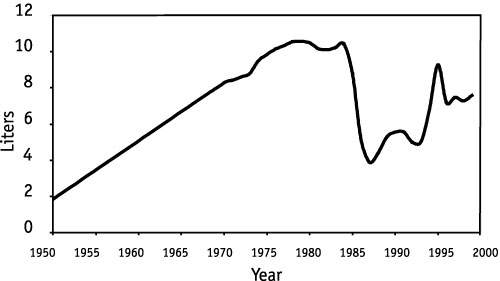
women's average life expectancy. The extrapolation of the data presented in
this chart in commonly known data on the change into men's life expectancy
between the late 1980s through to early 1990s (see Fig.3) exposes a connection
between these particular indices and the fiasco of the Gorbachev's anti-alcohol
campaign (see Table 12).
Fig. 3
Consumption of alcohol as an absolute alcohol equivalent per capita in Russia in 1950-2002
Consumption of alcohol as an absolute alcohol equivalent per capita in Russia in 1950-2002
Source:
Demoscope, №19-20, May 7-20, 2001. (http://www.demoscope.ru/weekly/019/tema01.php)
1 BSE. – М., 1950, vol.2, p.118,
http://optimalist.narod.ru/bro01.htm (the data on 1950)
Demoscope, №19-20, May 7-20, 2001. (http://www.demoscope.ru/weekly/019/tema01.php)
1 BSE. – М., 1950, vol.2, p.118,
http://optimalist.narod.ru/bro01.htm (the data on 1950)
Table 12. The life expectancy of a Russian (the average life expectancy at birth) from 1950 to 2000
| Years: | Life expectancy (years) |
| 1950-1955 | 60.5 |
| 1955-1960 | 62.5 |
| 1960-1965 | 63.3 |
| 1965-1970 | 64.5 |
| 1970-1975 | 63.8 |
| 1975-1980 | 62.7 |
| 1980-1985 | 62.6 |
| 1985-1990 | 64.9 |
| 1990-1995 | 60.8 |
| 1995-2000 | 60.2 |
Source:
Population division of the Department of Economic and Social Affairs of the United Nations, World Population Prospects: The 2000 Revision and World Urbanization Prospects: the 2001 Revision. http://esa.un.org/unpp
Population division of the Department of Economic and Social Affairs of the United Nations, World Population Prospects: The 2000 Revision and World Urbanization Prospects: the 2001 Revision. http://esa.un.org/unpp
It is safe to assume that had the social cataclysms of the 20th Century, i.e.
the earlier than average women's accession to employment and the strong-rooted
alcoholic traditions of the early industrialisation stage, not taken place
Russia's population would currently have been abound 300 million (assuming that
Russia's share of the global population stayed at its 1913 level).
The leading countries of our time have only a vague vision of their future and
the long-term challenges they face. They created many of their important
institutions and establishments meant to address a certain set of circumstances
only to see those circumstances alter dramatically in the years ahead. Today,
some of the key structural challenges facing the nations of Western Europe,
North America, and Japan are directed towards securing the sustainability of
their pensions, health care and education systems. The latter were developed in
the conditions of a young populace, seemingly vast opportunities for increasing
tax revenues, and modest respective expenditures in GDP. The situation has
changed radically in 50 years of post-industrial development. And the leading
nations are now realising that fundamental strategic reforms are difficult to
implement in mature, stable democracies.
Russia must analyze the challenges facing developed nations not for a blind
replication of Western solutions but for carefully adjusting Western
experiences to Russian specifics and ensuring that a possible problem is
addressed before it entrenches and a needed reform is overdue. A. Gershenkron
argued that both Russia and the whole world had paid a high price for the
belated emancipation of the Russian peasantry[14], for Russia's belated start
of modern economic growth and the backwardness from the leading Western
European economies in which it resulted. It is ever more important then to take
advantage of the earlier beaten track: that is, to profit from both mistakes
those of our own and those of others'.
3. There is, of course, a group of countries that started modern economic growth
notably later than the leaders, but managed to catch up with them. The shining
example in this respect is Japan that had started its economic growth
practically at the same time as Russia did and managed to enter the group of
leaders by the 1970s.
4. As emphasized by A. Maddison. See: A.Maddison. Dynamic Forces in Capitalist
Development. A Long-Run Comparative View.
– Oxford- New York: Oxford University Press, 1991. P 15.
5. He was keen to explore how the catch-up development countries, less developed
compared with the Netherlands and the UK and the countries of continental
Europe could introduce such changes to the system of their national
institutions and their economic policies which would allow them to reach the
Dutch level of development.
7. A characteristic example in this respect is Prof. V.I. Grinibetsky's paper
'Poslevoyennye perspectivy russkoy promyshlennosti (Post war prospects of
Russia's industrial sector) that had a serious impact on development of the
GOELRO (the nationwide electrification) plan in the Soviet Union. The author
uses an analysis of the difference in Russia's fuel balance from those of more
the developed nations as one of the starting points.
8. Table 3 can form a basis for overly optimistic conclusions on a gradual trend
towards a reduction in the distance between Russia and the leading nations.
However, it should be taken into account that in the early 1950s both Germany
and France's indicators were still under a strong impact of effects of World
War II.
10. The data on Spain is provided because that country's path of demographic
transition is close to Russia's.
11. According to the annual data of GKS of RF, it was the period between 1965-66
when the life expectancy rate reached its peak in Russia. See: Demographichesky
ezhegodnik Rossii. M., 2001.
12. See: S.Zakharov. Kohortny analyz smertnosti naselenia Rossii (dologosrochnye
I kratkosrochnye effecty neravenstava pokoleniy pered litsom smerti)//Problemy
prognozirovania, 1999. # 2/ P 114-31.
13. J.C.Roberts. Drink and Industrial Discipline in Nineteenth-Century Germany.
The Industrial Revolution and Work in Nineteenth-Century Europe. London-New
York, 1992. ?. 102-124.
14. A.Gerschenkron. Economic Backwardness in Historical Perspective.- Cambridge-
Massachusetts: The Belknap Press of Harvard University Press, 1962.